Sine waves and signal processing
Notes by Teun Mathijssen · Teun M.
The wave on my homepage cycles through frequency, phase, amplitude, quantization and interference. These are the signal processing ideas behind the animation, and a few details that make the changes easier to see.
Start with a sine wave
A sine wave can be written as x(t) = A sin(2πft + φ). Amplitude A sets its height, frequency f sets the number of cycles per second, and phase φ sets its position within a cycle. The plot shows a one-second window; horizontal position represents time and vertical position represents signal amplitude.
Frequency: change the spacing
Increasing frequency fits more cycles into the same window. The period is T = 1/f: at 2 Hz, one cycle takes half a second. In this demo, the dashed peak-to-peak line spans one period.
The frequency transition is centered on a trough. Anchoring that trough keeps the wave from sliding sideways while its peaks move closer together or farther apart.
Phase: move through a cycle
Changing phase moves the wave horizontally without changing its frequency or amplitude. A phase change of 2π radians is one full cycle, returning the signal to the same shape and position. The moving dashed line follows one zero crossing.
Amplitude: scale the height
The amplitude transition scales the signal about zero. Its dashed line measures from zero to a positive peak. The smallest amplitude is one third of the largest, while the quantization levels stay fixed. Turning down the wave therefore uses fewer levels; it does not move the levels closer together.
Quantization: turn a curve into steps
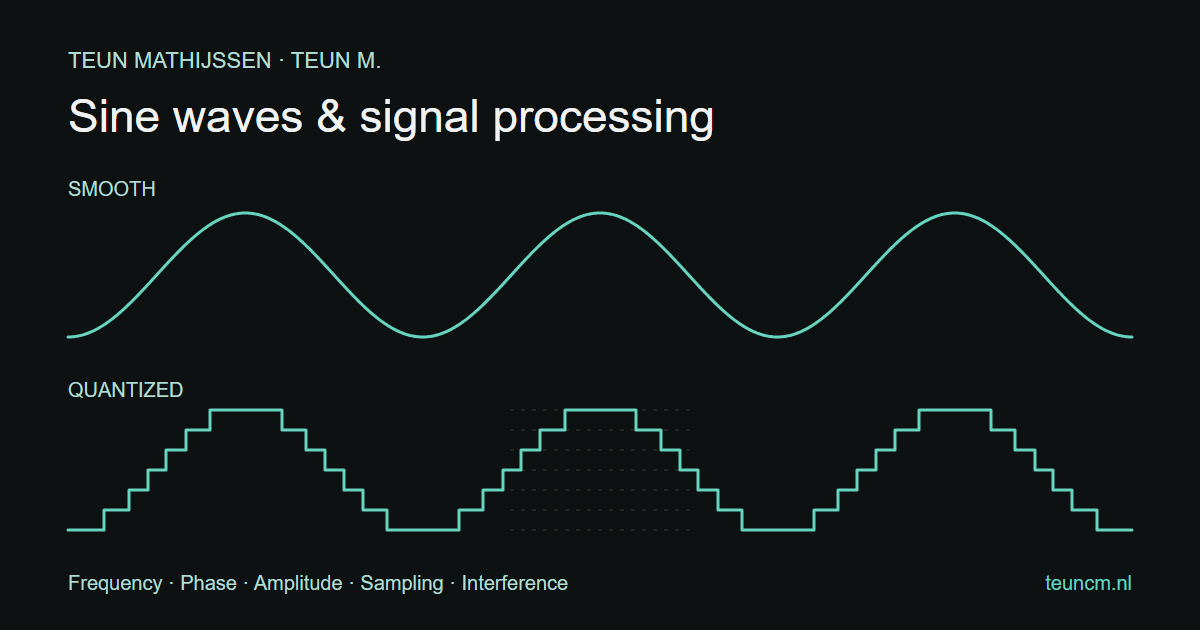
Amplitude quantization rounds values to a set of levels. For a level spacing Δ, the operation is Q(x) = Δ round(x/Δ). Larger spacing produces more obvious steps. The centered horizontal markers show the available levels.
This is the amplitude-reduction part of a bitcrusher. The demo blends between the original signal and the rounded signal so the transitions stay fluid. It also sometimes returns to the smooth wave; the highlighted curve follows that change.
Sample dots and quantization are different
The 33 dots are evaluations of the signal at evenly spaced times. Their horizontal positions are discrete, but that alone does not quantize their vertical values. With amplitude quantization off, each dot sits on the smooth sine wave. With it on, the dot follows the processed signal.
The curve itself is drawn with many more segments than the sample dots. Reducing the number of dots and reducing amplitude resolution are separate operations.
The chorus transition: two waves interfering
The chorus-inspired transition adds two copies of the signal, each at half amplitude, then shifts the second copy through one full phase cycle. The vertical lines mark its starting position, destination and current position.
For an unquantized sine wave, the sum simplifies to A sin(θ + δ/2) cos(δ/2), where θ is the original phase and δ is the phase difference between the copies. At half a cycle of difference, the copies cancel. After a full cycle they line up again, so the second copy can be removed without a jump.
This is a visual demonstration of interference. An audio chorus usually mixes a signal with a short, modulated delay; the demo uses a phase sweep instead. When quantization is active, each copy is quantized before the two are added.
Drawing it efficiently
The plot uses WebGL2 when available and falls back to Canvas 2D. Drawing is capped at 30 frames per second and pauses when the plot is off-screen or the tab is hidden. Reduced-motion preferences keep the plot still. Smooth curves use fewer segments than stepped ones, and the smooth chorus uses the equivalent single-sine expression above.
Source code for this site · Sampling and quantization in The Scientist and Engineer’s Guide to DSP